The whole idea in a minute: the dot, the odds, the plan. Sound on.
What you’ll see
Real screens from a real day — captured from the app, not mock-ups. Swipe through.
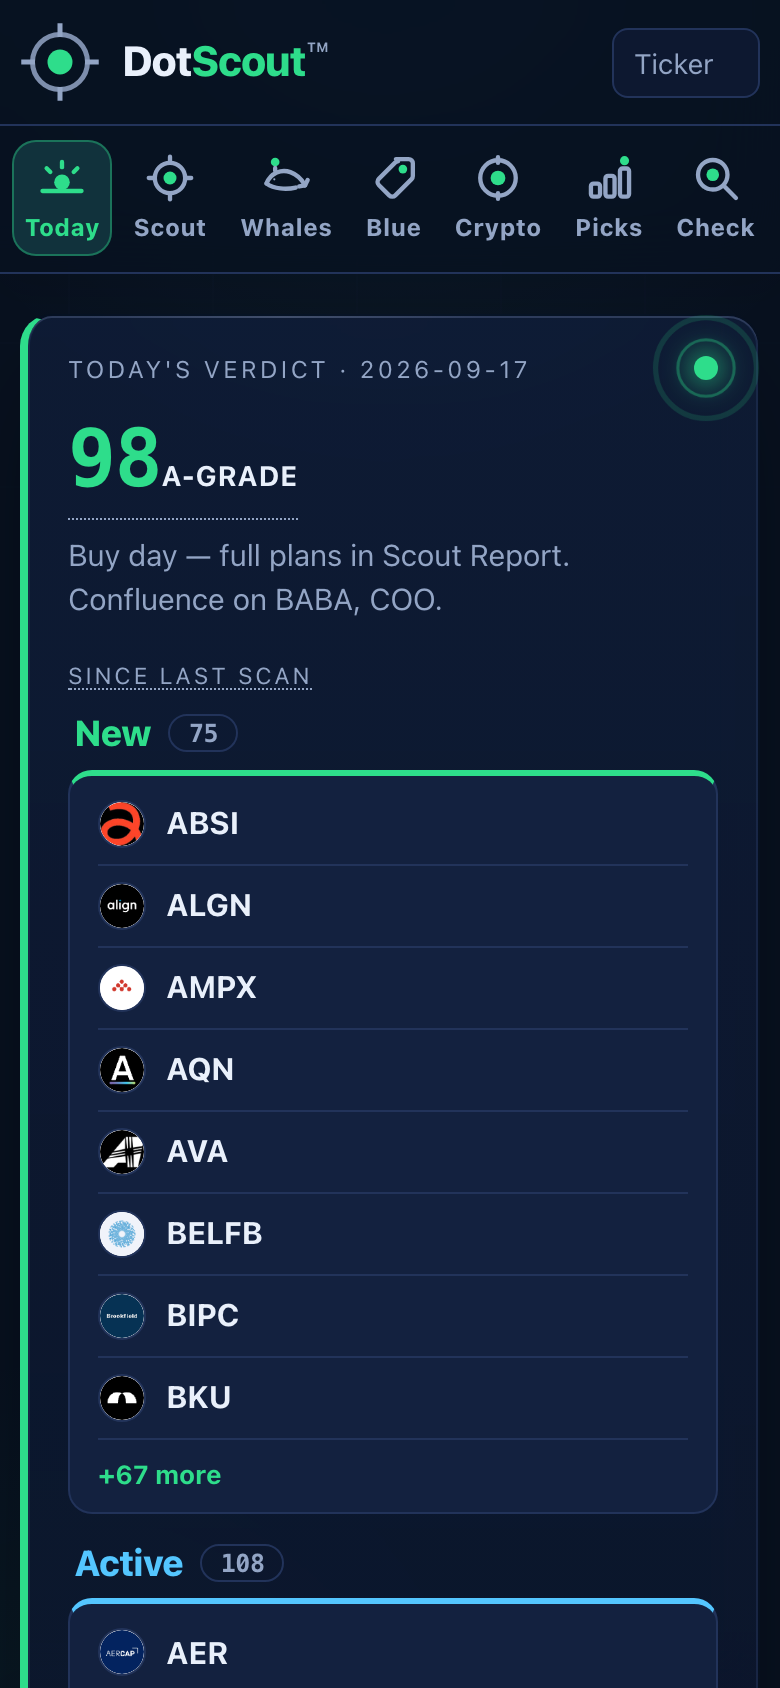
Today
The verdict in one number: how many setups passed every test tonight, and what kind of day it is.
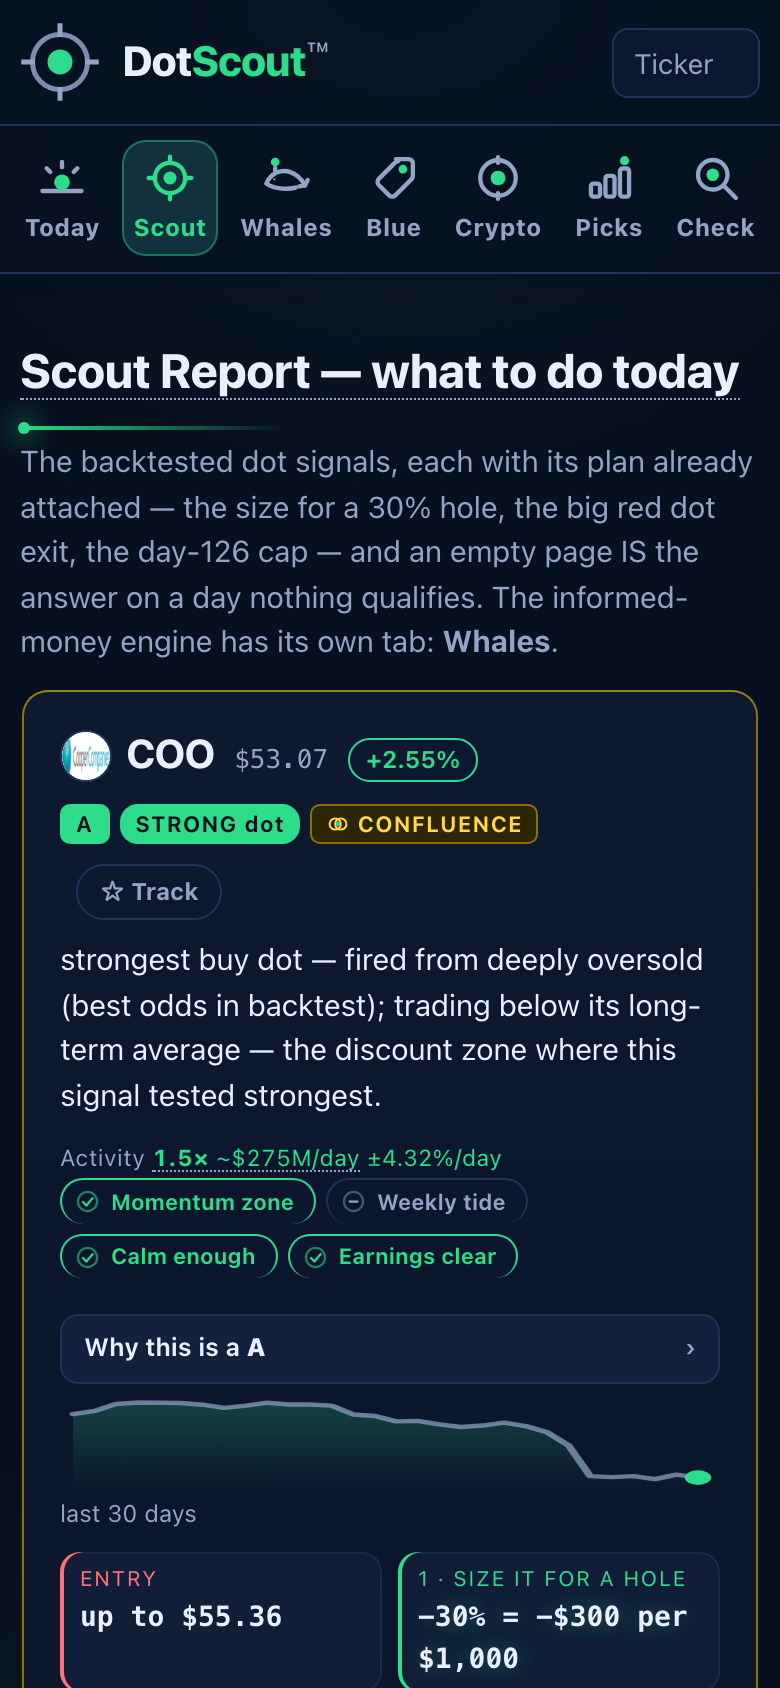
Scout Report
Each pick as a story card: what happened, who is buying, the odds for this exact pattern, and the plan.
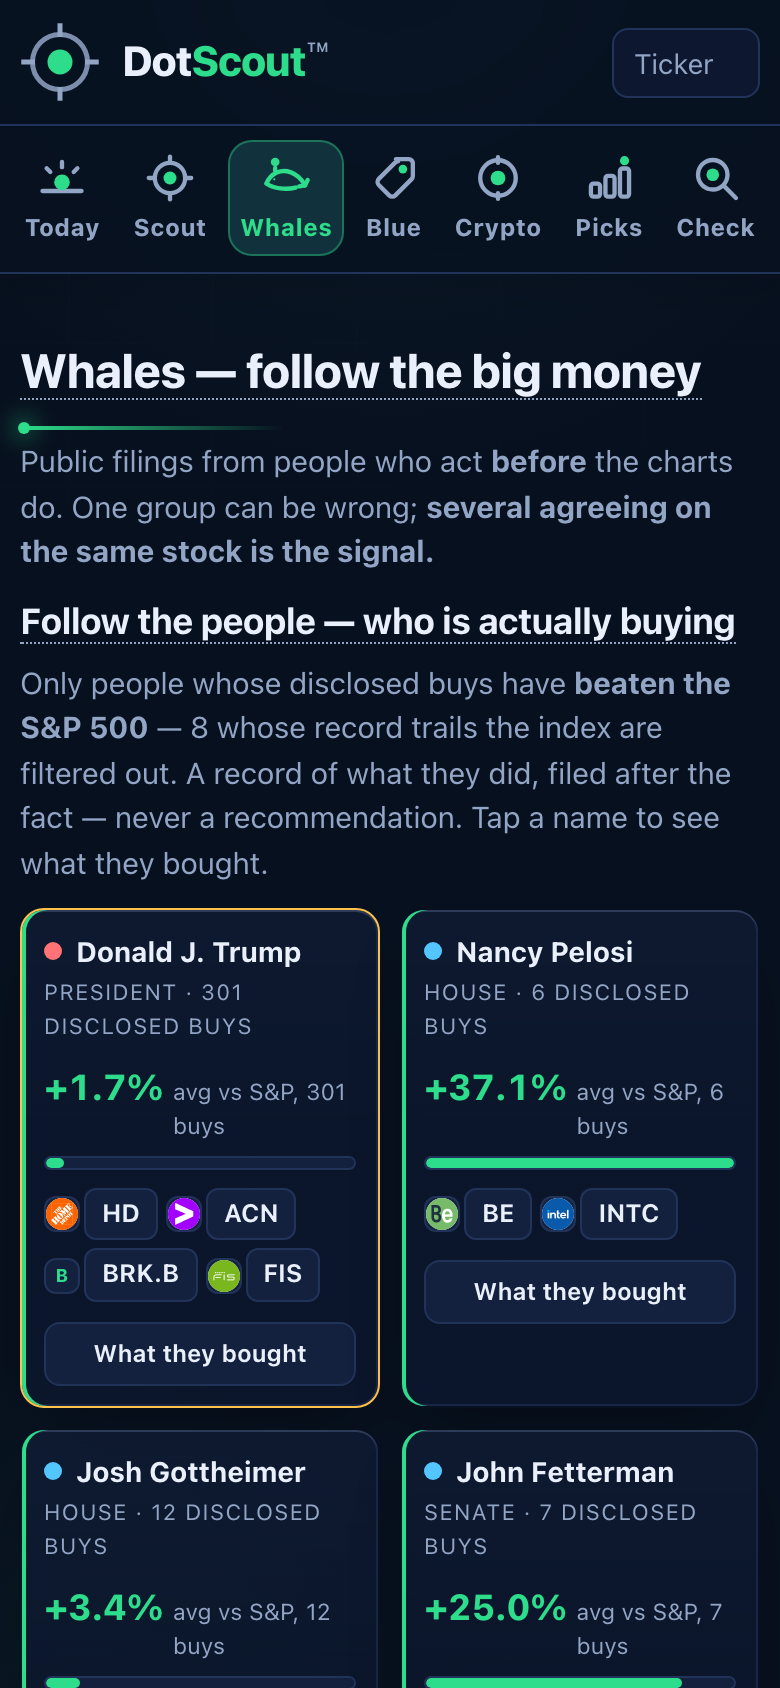
Whales
Congress trades, insider buying and fund flows, ranked by whose record beats the S&P.
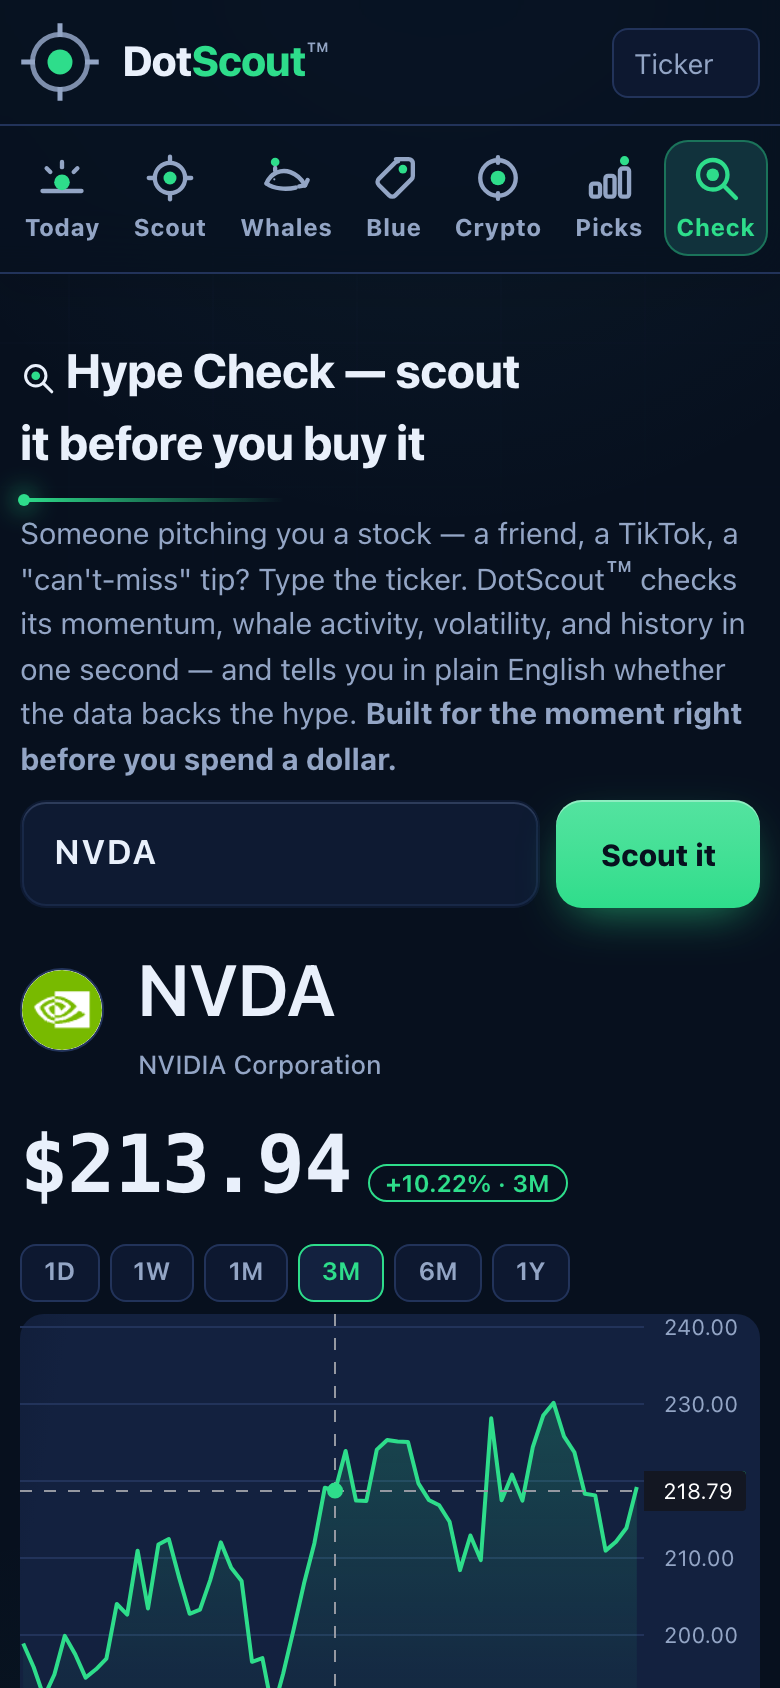
Hype Check
Type any ticker. One second later: is it overheated, are whales in it, how wild is it.
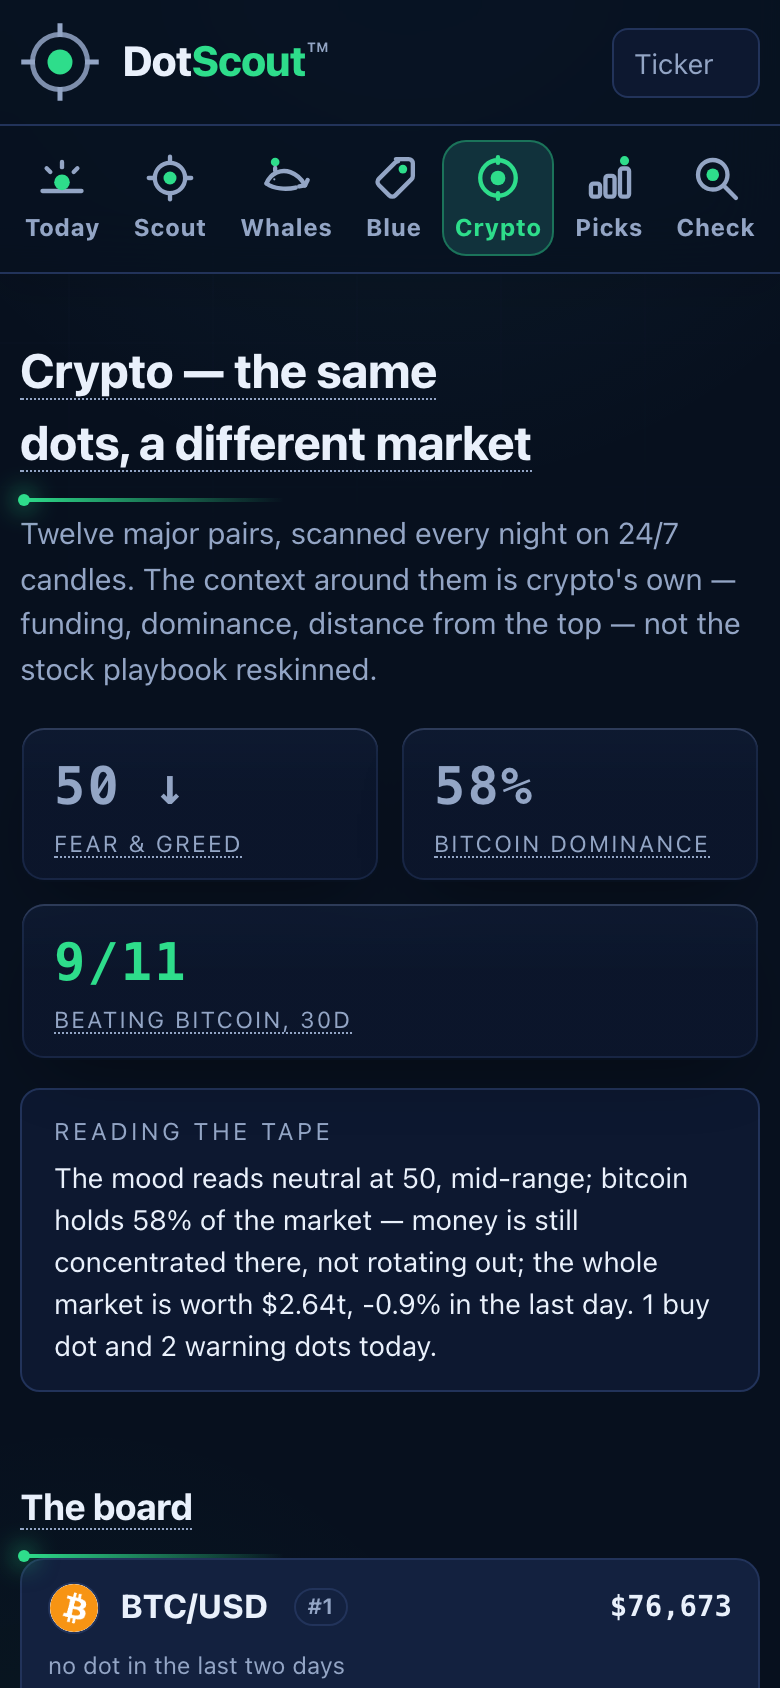
Crypto
Twelve coins with crypto-native context: funding, dominance, distance from the top.
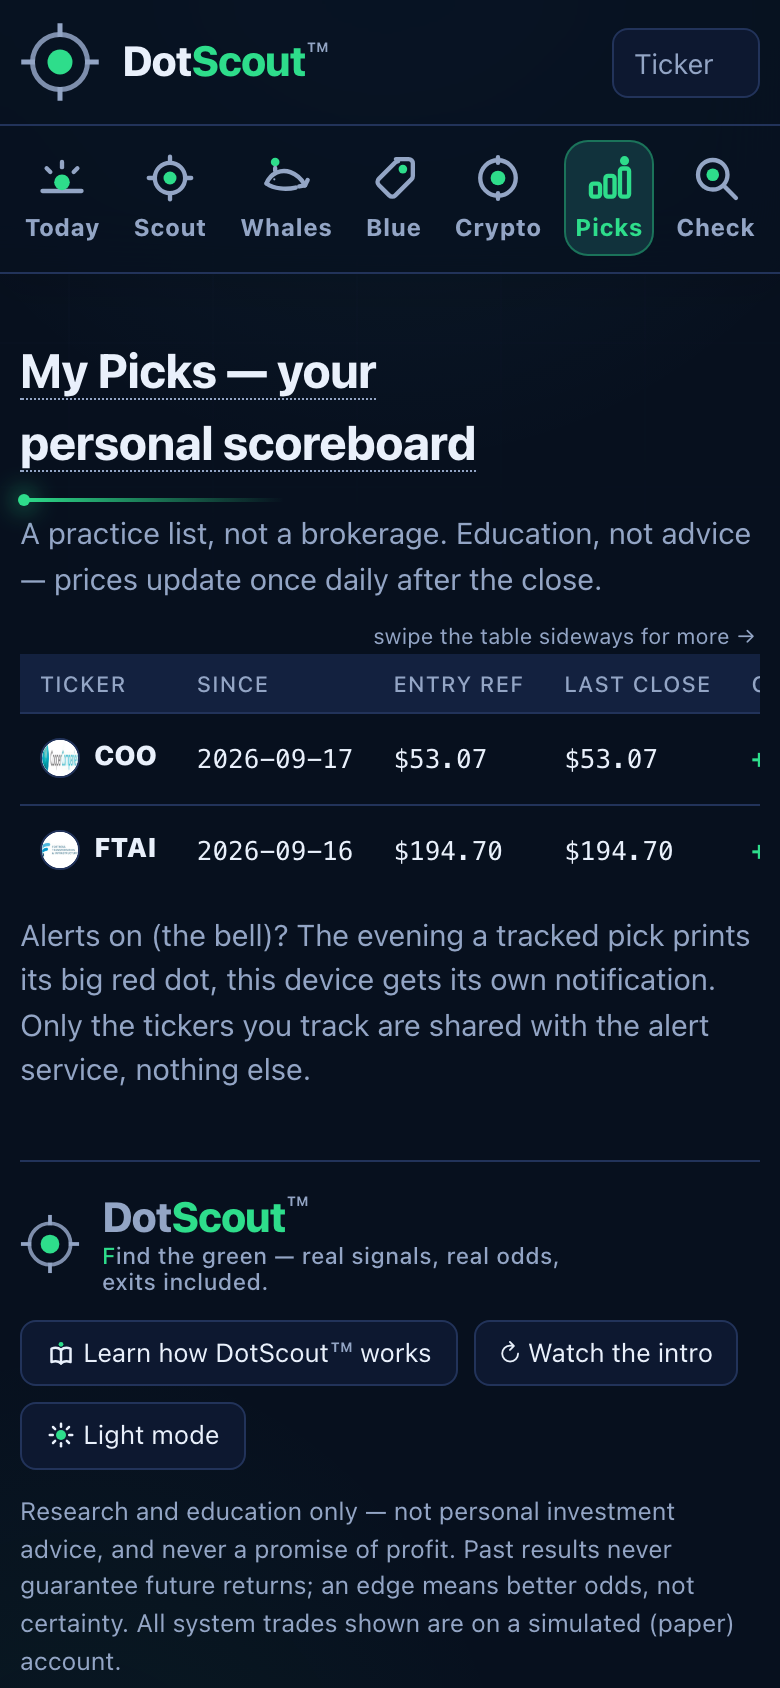
My Picks
Your private practice list, re-graded every evening. Lives on your phone only.
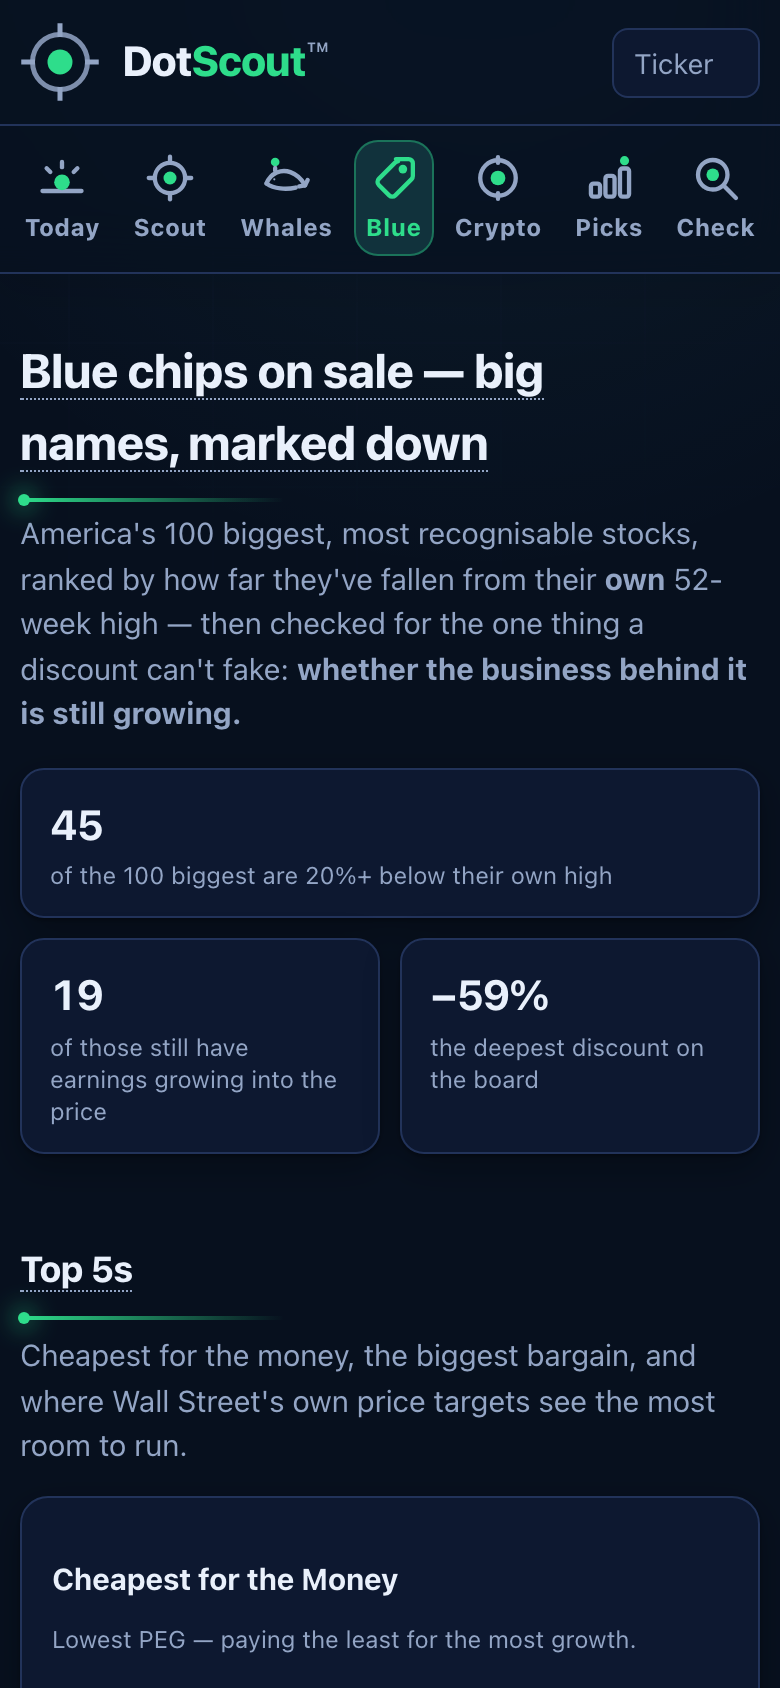
Blue Chips
The household names on sale right now, and the case for each.
← swipe →
Every market day, twice a day
DotScout runs so you don’t have to. Open it with your coffee; it already worked all night.
Morning — fresh scout report
Thousands of stocks checked overnight. Only setups whose exact signal pattern historically beat
chance make the report — and only in stocks that trade $50M+ a day, the line where the record held
up in both the history and our own live record. The list is at most twelve a day: the deepest discounts,
at least 30% below their 52-week high, first. Each comes with its odds shown, and the day’s Market
Weather saying what to expect from them.
One exit, decided before you buy
Every pick ships with the same plan: hold it until the big red dot — the morning the
daily gauge turns down from the overheated zone — or until day 126, whichever comes first, and
size it so a 30% hole is a shrug. No stop, because on three years of history a stop made the plan
worse. The size question is answered before a dollar moves.
Evening — every pick re-graded
After the close, every live idea is re-graded against its plan and the day’s big red dots are
named. Levels refresh; nothing drifts stale.
Overnight — the odds check
Every candidate is graded against 55,870 historical signals from three years of
markets. Kinds that never beat chance are thrown out while you sleep — and every pick
that survives shows the real numbers for its exact pattern, right on its card.
55,870 signals. Three years of history.
Every kind of signal DotScout can fire was tested against three years of market data.
Only the kinds that historically rose more often than chance are allowed into your report —
and every pick shows the real numbers for its exact pattern. That is historical research,
not a guarantee: it means favorable odds, never certainty.
What to expect, by market weatherbacktested
Market state
rose
per trade
signals
Washout
85%
+15.61%
1,371
Rolling over
73%
+8.58%
2,111
Calm uptrend
67%
+5.24%
3,335
Backtested: 6,817 A-grade signals over three years (2023–2026), each ridden to the first big red dot or day 126 with no stop, small costs included; the same rule made +5.3% a trade through the 2022 bear. History, not a promise: it benefits from hindsight and cannot fully reflect real fills. The setup earns its keep in stressed markets and idles in calm ones — every morning the app says which kind of day it is.
No live performance record is published here, and none is promised. DotScout is research and
education: the odds come before the trade, labelled as history, and every evening the app re-grades
every open idea against its own plan. What you do with a pick is yours.
Pricing
Join the list before checkout opens. Monthly, cancel anytime.
The list price is what everyone pays after launch.
Learn the setup
Basic
$19.99/ mo
list price, the same after launch
monthly · cancel anytime
Top 3 picks a day — the verdict, the grade, the reason, and the exit rule
Today’s verdict + Market Weather with what to expect, and the five-minute Learn deck
Hype Check, 5 lookups a day · My Picks on your device
No charge todayMonthly, cancel in one clickSame report for every plan, same minuteNever trades for you
Bring a friend. When someone joins the list with your invite link, you both get an extra
month of Core free. Your link appears the moment you save your spot below.
Auto-Alert — signals to your own automation PRO
The instant a signal fires, we can POST it as JSON to a URL you control — point
that at your own broker’s automation tools and decide what happens next. We never see your broker,
never hold a credential, and never place an order. Data only, always. That is not a lighter promise
than Core’s — it is the same one: DotScout informs, you decide.
{
  "ticker": "REZI",
  "signal": "buy_dot",
  "grade": "A",
  "close": 24.10,
  "exit_rule": "first_big_red_dot_or_day_126",
  "check_in_day21": "2026-10-16",
  "day126_cap": "2027-03-18",
  "size_note": "size for a 30% hole; no stop"
}
Every payload is signed (HMAC-SHA256) so your receiving server can verify it genuinely
came from DotScout. Pro members switch it on themselves from the Scout tab: paste a URL, get your
signing secret, send a test — two payloads a market day, the picks and the big red dots.
Join the waitlist
No charge today. We email you the moment checkout opens.
You’re on the list. Watch your inbox. 🎯
Your invite link
A friend joins with it, and you both get an extra month of Core free.
One email at launch, occasional updates after. Unsubscribe anytime. Daily verdict only if you tick the box.
Fair questions
How does the friend invite work?
Save your spot and you get a personal invite link. Anyone who joins the waitlist through it is
counted as yours; when checkout opens, you and each friend get one extra month of Core free.
No limit on friends, no spam from us on your behalf, and we only ever email
the people who signed up themselves.
Is this financial advice?
No. DotScout is research and education: the same impersonal report goes to every subscriber,
on a schedule, tailored to nobody. We never give personalized recommendations, and we are not a
licensed investment adviser. What you do with the information is your decision.
Why does a good setup have bad months?
Because the signal is a stressed-market tool. Across three years of history it rose nearly three
times in four when the index was under its 200-day average, and was a coin-flip that averaged nothing
in a calm uptrend. Those are backtested numbers, labelled as such. The Market Weather card tells you
which kind of day this is, so you can size down or sit one out — the lesson most beginners pay for
the hard way.
Do you publish a trading record?
No. DotScout is research and education, not a performance service. Every kind of signal carries its
historical odds, labelled as backtested; what a pick does after you buy it is graded on your own My
Picks every evening. We do not publish a live trading record and we do not sell one.
Will it trade for me?
Never, on any plan. DotScout informs; you decide. We hold no brokerage connection, no
login credentials, and no ability to place a trade on your behalf — by design,
permanently. Pro’s Auto-Alert delivers the same signal to a URL you control the instant it
fires; what you build with that, in your own broker’s own automation, is entirely yours. We
are a data source. We are never a trader.
What’s the difference between the plans?
Basic is the top three picks of the day, each with its exit rule — the same three the
other plans see, at the same minute. Core is the whole scanner: every pick with its full plan,
the Crypto tab, Blue Chips and the daily email. Pro adds the informed-money layer for more
active traders: Whales, the followed filers whose record beats the index, and Auto-Alert
(signals delivered by webhook the moment they fire). No plan gets earlier information than another.
Refunds?
Plans are monthly and cancel with one click — you keep access through the end of the month
you paid for, and there are no refunds. A month is the trial.
What do the odds actually mean?
Each signal kind was measured across three years of history — how often that exact pattern
rose over the following days versus ordinary days. Favorable odds are a tilt, not a promise:
plenty of individual picks lose, which is why every pick ships with its exit rule and its size.
What if I subscribe and it’s not for me?
Cancel anytime in one click — no phone call, no retention offer, no questions. You keep access through the end of the period you already paid for.